Multimedia |
Messengers |
Desktop |
Development |
Education |
Games |
Graphics |
Networking |
Security |
Servers |
Utilities |
Web Dev
Rt-Plot
By Rt-Science
Rating:
 2.9/5 (16)
2.9/5 (16)
Price:
29.90$ Purchase
Home page:
www.rt-science.de
Latest version:
2.8.10.84
Last updated:
November 21st, 2009
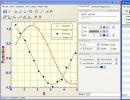
Rt-Plot is a tool to generate Cartesian X/Y-plots from scientific data. You can enter and calculate tabular data. View the changing graphs, including linear and non linear regression, interpolation...